Three Dimensional Iterative Scouring Methodology
Sixty percent of bridge failures are the result of riverbed erosion (scour) at bridge support structures, and about 1 in 20 bridges are classified as scour critical, meaning that they are in danger of failure during a major flood event. Working to improve scour analysis, researchers at TRACC have developed and tested a 3-D method of predicting the shape and depth of a scour hole that forms under a flooded bridge deck. The 2 figures below represent the surface of a stream bed with a scour hole. The top figure (a) shows experimental results; the bottom figure (b) shows computational results. Figure (a) was created from measurements taken from an experiment conducted at the Turner Fairbank Highway Research Center (TFHRC). Figure (b) was created from a CFD simulation of the experiment. Although the simulation did not yet include models for bed forms and sediment deposition, it does match the experimental data quite well. The scour methodology predicts a deeper scour depth than the actual experimentally measured depth. This result is considered satisfactory in the current work because it does not underestimate the scour depth or lead to the consequent underestimation of the risk of bridge failure due to scour.
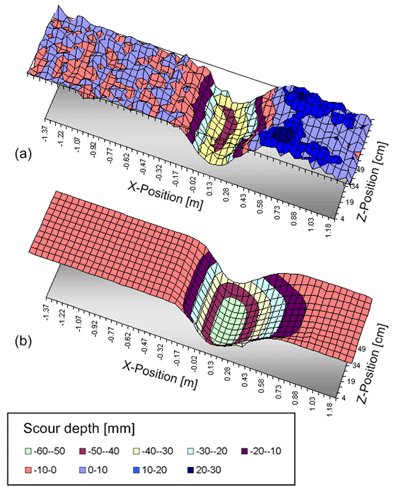
3-D scour map for a laboratory scale scour hole beneath a flooded bridge deck
(a) Experimental (b) Numerical simulation
CFD Modeling and Analysis of Flow through Culverts
The Federal Highway Administration (FHWA) estimates that there are more than 12 million linear feet of culverts installed in the U.S. every year, and they are engaged in research to improve culvert design guidelines. As part of this effort, full three dimensional CFD simulation of culvert flow experimental work at the TFHRC hydraulics laboratory is conducted at TRACC. Simulation results compare favorably with the available experimental water level height data. The top of the diagram below shows an overhead view of the experimental culvert set up at the TFHRC. The rest of the diagram shows simulation results at 3 different cross section positions in the culvert barrel. The left side of the diagram illustrates how the water level inside the culvert is decreasing as the water flows down the culvert. The right side of the diagram illustrates how the water velocity is increasing and is skewed toward the right of the culvert.
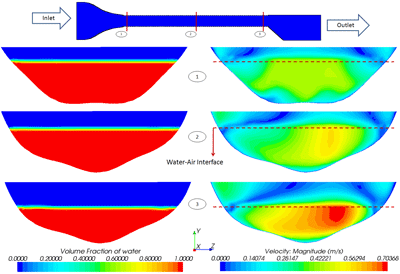
Volume fraction of water and velocity contour plots shown on three different cross sectional planes
Highlight of the Research Work Carried Out at the University of Iowa on the TRACC Cluster
University of Iowa researchers are engaged in the study of detailed flow vortex structures generated at bridge abutments and piers to better understand the causes of erosion of the riverbed at the bridge during floods that could result in bridge failure. Large high performance cluster computers like the one at TRACC are required to conduct such detailed analysis of flows at bridges. The figure below depicts flow around an abutment with vortex structures in the mean (left) and instantaneous (right) flow at a) the free surface; b) 0.5D from the bed; and c) 0.2D from the bed where D is the channel flow depth. This figure shows exquisite detail in instantaneous flow structures on the right that can be obtained from transient computations using eddy resolving techniques compared to the vortex structures of the mean flow on the left. Study of the instantaneous structures, including the time evolving variation in their strength and interactions with the stream bed will lead to a more fundamental understanding of the flow physics that causes riverbed erosion commonly referred to as scour.
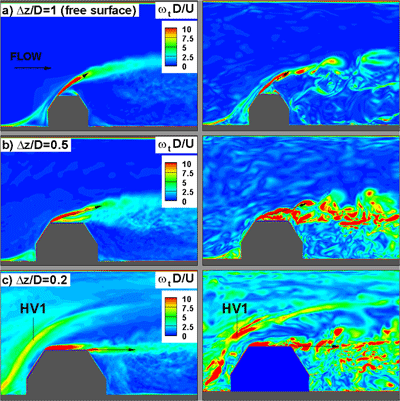
Vortical structure in the mean (left) and instantaneous (right) flow at a) the free surface; b) at 0.5D
from the bed; and c) at 0.2D from the bed (D is the channel flow depth)